
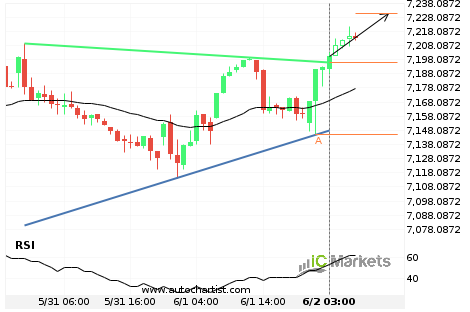
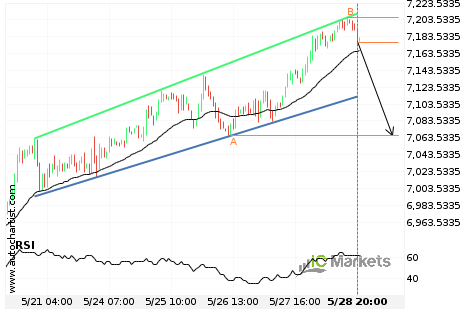
Australia 200 Index has broken through resistance
Australia 200 Index has broken through the resistance line of a Triangle. It has touched this line at least twice in the last 3 days. This breakout indicates a potential move to 7230.6003 within the next 11 hours. Because we have seen it retrace from this positions in the past, one should wait for confirmation […]
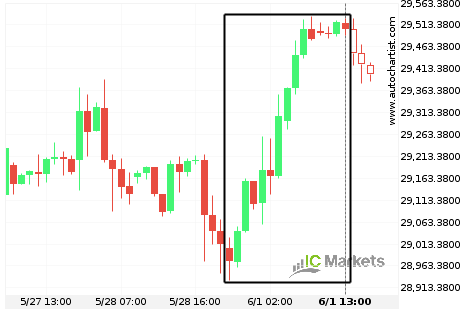
Hong Kong 50 Index experienced an exceptionally large movement
For those of you that don’t believe in trends, this may be an opportunity to take advantage of an exceptional 1.83% move on Hong Kong 50 Index. The movement has happened over the last 2 days. For those trend followers among you, you may think about riding this trend.
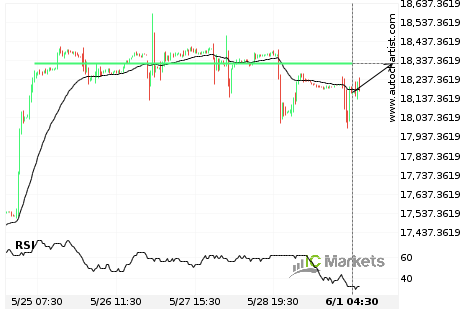
Should we expect a breakout or a rebound on FTSE China A50 Index?
The movement of FTSE China A50 Index towards 18318.9395 price line is yet another test of the line it reached numerous times in the past. We expect this line test to happen in the next 22 hours, but it is uncertain whether it will result in a breakout through this line, or simply rebound back […]

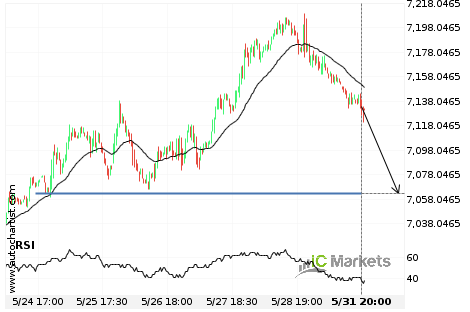
A final push expected on Australia 200 Index
Australia 200 Index is heading towards a price line of 7062.6201 and could reach this point within the next 2 days. It has tested this line numerous times in the past, and this time could be no different from the past, ending in a rebound instead of a breakout. If the breakout doesn’t happen, we […]
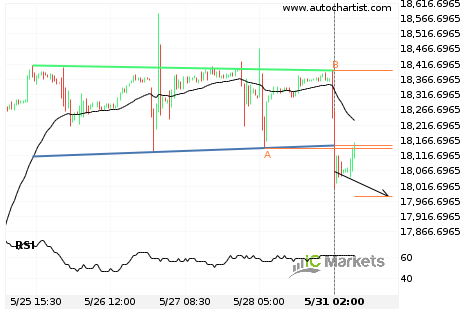
FTSE China A50 Index has broken through support
FTSE China A50 Index has broken through the support line of a Head and Shoulders. It has touched this line at least twice in the last 6 days. This breakout indicates a potential move to 17982.5784 within the next 18 hours. Because we have seen it retrace from this positions in the past, one should […]

Australia 200 Index – getting close to support of a Channel Up
Australia 200 Index is moving towards the support line of a Channel Up. Because we have seen it retrace from this line before, we could see either a break through this line, or a rebound back to current levels. It has touched this line numerous times in the last 8 days and may test it […]
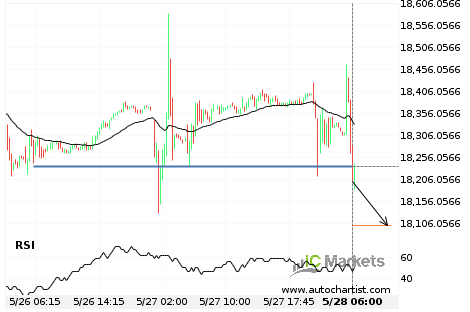
Should we expect a bearish trend on FTSE China A50 Index?
The breakout of FTSE China A50 Index through the 18234.4102 price line is a breach of an important psychological price that is has tested numerous in the past. If this breakout persists, we expect the price of FTSE China A50 Index to test 18101.0781 within the next 10 hours. One should always be cautious before […]